
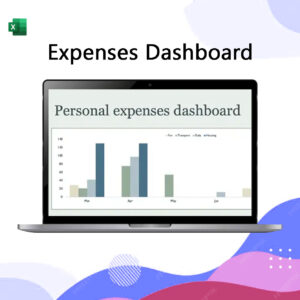
An effective Expenses Dashboard mockup in Excel centers on a dynamic visual summary that transforms raw transaction data into actionable insights, utilizing a “Slicer” panel for filtering by Category, Date Range, and Payment Method. The layout should feature high-level Key Performance Indicators (KPIs) at the top showing Total Expenses, Budget Variance, and Month-over-Month Growth, supported by a Trend Line Chart for longitudinal analysis and a Doughnut Chart to illustrate the percentage distribution of spending categories. To maintain data integrity and usability, the underlying structure should leverage an Excel Table for easy data entry, linked to Pivot Tables that automatically update the dashboard visuals, allowing for a quick drill-down into specific cost centers like operational overhead, marketing, or freelance-related disbursements.

Expenses Dashboard
฿10.00
& Free ShippingAn effective Expenses Dashboard mockup in Excel centers on a dynamic visual summary that transforms raw transaction data into actionable insights, utilizing a “Slicer” panel for filtering by Category, Date Range, and Payment Method. The layout should feature high-level Key Performance Indicators (KPIs) at the top showing Total Expenses, Budget Variance, and Month-over-Month Growth, supported by a Trend Line Chart for longitudinal analysis and a Doughnut Chart to illustrate the percentage distribution of spending categories. To maintain data integrity and usability, the underlying structure should leverage an Excel Table for easy data entry, linked to Pivot Tables that automatically update the dashboard visuals, allowing for a quick drill-down into specific cost centers like operational overhead, marketing, or freelance-related disbursements.
Reviews
There are no reviews yet.